Year end stats in pictures
- Thread starter 30ashopper
- Start date
-
Trouble logging in? Send us a message with your username and/or email address for help.
You are using an out of date browser. It may not display this or other websites correctly.
You should upgrade or use an alternative browser.
You should upgrade or use an alternative browser.
New posts

That's probably why most people laugh when they read "predictions". ;-)


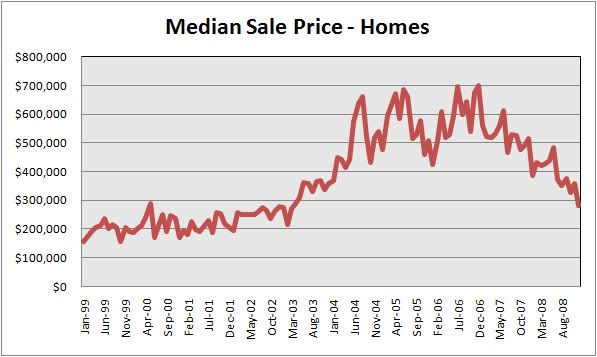
Will you explain the difference between the term average sales price and median sales price for me?

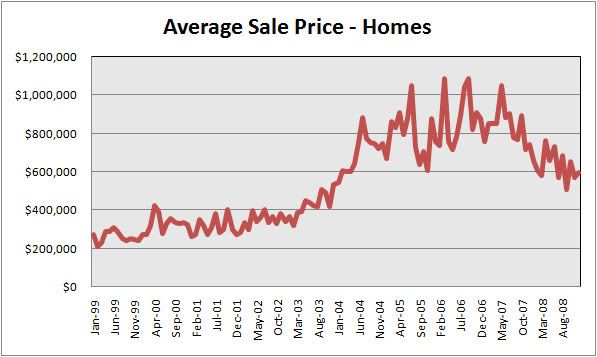
AVERAGE SALE PRICE: $625,000 (Sum/# Sold)
MEDIAN SALE PRICE: $200,000 (Number @ mid-point of high and low)
House 1 Sold for $75,000
House 2 Sold for $150,000
House 3 Sold for $200,000
House 4 Sold for $900,000
House 5 Sold for $1,800,000

I'd bet on it--that's where the majority of sales are happening out there....well, that and the folks who plunked down $75K for condoz in the 80s and are selling out for $300K now.
.
New posts
Thanks 30ashopper. Very nicely done.
It's interesting that no matter whether you view stock graphs or real estate graphs, the line is a series of drunken m's.
That's probably why most people laugh when they read "predictions". ;-)

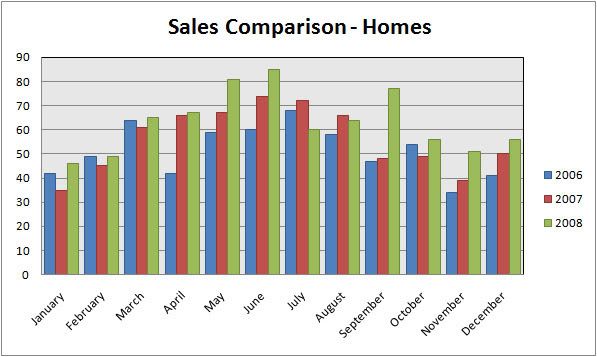
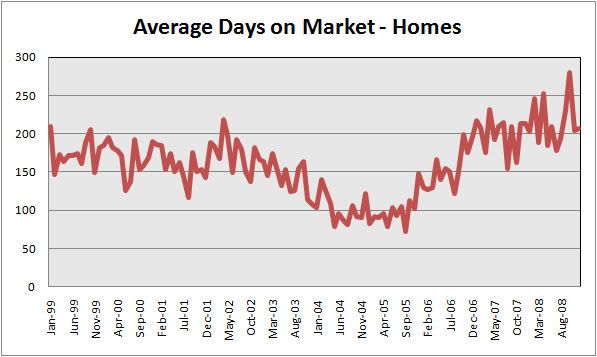
ECAR stats, areas:14,15,16,17,18. Hat tip to Josh for the data.
Sales picking up -
Median and Average sale price declines -
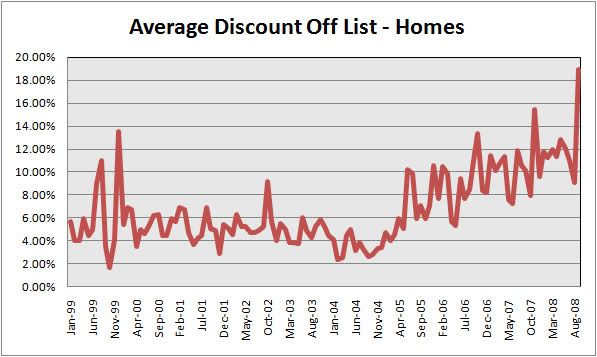
Lowballers paradise -
Average number of days on the market for homes that sold -
Will you explain the difference between the term average sales price and median sales price for me?
Will you explain the difference between the term average sales price and median sales price for me?
AVERAGE SALE PRICE: $625,000 (Sum/# Sold)
MEDIAN SALE PRICE: $200,000 (Number @ mid-point of high and low)
House 1 Sold for $75,000
House 2 Sold for $150,000
House 3 Sold for $200,000
House 4 Sold for $900,000
House 5 Sold for $1,800,000
Average = sum of all sales/number of sales
Median = middle number of sales (w/ outliers thrown out)
Are they attributing the higher number of sales and lower prices in 2008 to more foreclosures/short sales?
Median = middle number of sales (w/ outliers thrown out)
Are they attributing the higher number of sales and lower prices in 2008 to more foreclosures/short sales?
Are they attributing the higher number of sales and lower prices in 2008 to more foreclosures/short sales?
I'd bet on it--that's where the majority of sales are happening out there....well, that and the folks who plunked down $75K for condoz in the 80s and are selling out for $300K now.
.
30A, Sorry I'm thick this evening. I am having a hard time interpreting Median from the graph as it is expressed in a line more fluid than the dates. Do you have any clarification on what SHELLY and SB proferred?