
I've been tracking prices now in a few key areas I'm interested in since January. For the non real estate types out there ReMax publishes a great hot list daily that can be found here that lists back on market, price changes, and new listings.
In just the last month I've seen a steepning decline in asking price with larger reductions, and a signifigant increase in listings in the last three months. Anybody else picking up on this vibe? I'm not sure what caused the flood of inventory in just the last few months and I also wonder why people are slashing prices all of the sudden. Did something go wrong with the spring selling season? I can't tell yet because Walton isn't up to date. Also, my data only goes back to January so maybe this is normal for the end of spring.
Replies
92
Banned
Cash Flow
It sounds like people who bought property that is not cash flowing were buying on speculation alone that prices would increase. I wouldn't recommend that anyone would do that. It sounds very risky and is a business I'm not sophisticated enough to be involved in.
The house we sold in Watersound West Beach this past year for $750,000 had a number of interested buyers and closed 1 day after C.O. If you look at the buyers VRBO listing you will see the type of rental return versus monthly carry I'm talking about. It's all public info.
I think people should keep it simple. I'm no genius and never will be. I do know that JOE sold us a lot at a price I thought was fair, we built a home in 110 days that met the finishes and need that buyers wanted, we received a contract that was fair to everyone, the bank felt they were secure with the mortgage, the home closed properly and is being used and enjoyed regularly.
No voodoo, no hidden agenda just old fashioned business 101.
:roll:
Beach Fanatic
real trend report for july
Real trend report for June--
SFH Volume down 20% and average price down 23%
Condos volume down 48% and average price down 44%
Lots volume down 30% and average price down 59%
Worst month we've seen in a long time.
Real trend report for June--
SFH Volume down 20% and average price down 23%
Condos volume down 48% and average price down 44%
Lots volume down 30% and average price down 59%
Worst month we've seen in a long time.
Edited

Beach Fanatic
Real trend report for July--
SFH Volume down 20% and average price down 23%
Condos volume down 48% and average price down 44%
Lots volume down 30% and average price down 59%
Worst month we've seen in a long time.
Price down compared with what, same month last year? Or last month?

SoWal Insider
Here's a link to a recent blog post, with inventory info and lots of other analysis of the numbers. Thanks Murray!
http://www.sowal.com/bb/blog.php?b=135
http://www.sowal.com/bb/blog.php?b=135
Beach Fanatic
Price down compared with what, same month last year? Or last month?
Compared to same month last year.
Beach Fanatic
Here's a link to a recent blog post, with inventory info and lots of other analysis of the numbers. Thanks Murray!
http://www.sowal.com/bb/blog.php?b=135
Not sure if Murray has his numbers quite right. He is a realtor and should be trying to spin a nice story. Unfortunately he doesn't do much analysis--like comparing year over year trends. He is only selectively pulling numbers versus the complete walco raw data noted above from the real trend report.
Murray's numbers don't jive with the numbers in the real trend report so someone has bad data. Also, Murray fails to compare numbers to the same month in 2007.
According to the real trend report (can't vouch for its accuracy), there were 143 homes sold in all of WalCo in June 2007 and only 115 in June 2008.
Murrays numbers indicate that the total dollar volume for the 98 sales in sowal was about $72 million. Real trend shows dollar volume for the 115 sales in all of walco at just $68 million.

Murrays numbers show 98 sold in Sowal and 14 in Freeport for a total of 112 in those two markets alone. Real trend shows 115 sales in ALL of walco.
Who has the correct data???? Maybe someone in the know can figure out which source is correct.
Edited
Beach Fanatic
Real trend report for July--
SFH Volume down 20% and average price down 23%
Condos volume down 48% and average price down 44%
Lots volume down 30% and average price down 59%
Worst month we've seen in a long time.
First, let me say that the latest "Real Trend" report was for June 2008, not July.
Don't mistake all of Walton County with sales in South Walton from Mack Bayou Rd to Inlet Beach. For that particular area, it was somewhere in the middle comparing each month to 2007, with Jan, Feb and April being better than June. However, June 2008 sales volume ($) was the highest month, year to date, with total sales of $42,414,148, which is 17% higher than our second best month this year (April).
For that area, the following are the numbers for June 2008:
SFD (single family detached homes)
34 % increase in qty of sales over 2007 (51 sales in June 2008)
13 % decrease in total dollar volume compared to 2007
If you review the last 24 months, you will see that June 2007 was the highest $ volume month we had, with sales volume of $48,169,400. Our second highest month in that same 24 month period was June 2008, with $42,414,148. By asking the question, "why?," you would know that in June of 2007, the Gulf Front home in Rosemary Beach sold for $7.88 million, only to be torn down to build a "nicer" home. That one home is one of the highest recorded home sales in Walton County and boosted the numbers greatly for June 2007. If that home hadn't sold, June 2008 would be the highest $volume month in the last 24 months and June 2008 would have been an increase over June 2007.
It is important to remember that stats have real numbers behind them, and if something looks "off," ask yourself, "what is the reason," do a little research, and discover the entire picture. One really high priced or low priced sale will skew the numbers quickly. As for lots in that same area, yes, sales ($) were very low, but they have been all year long. However, I can tell you that it was our second best month this year, falling only behind January sales.
If you want to know what areas are doing well, you need to break down the numbers, and if you want to know the real story of real estate, take the "Real Trend" report with a grain of salt. You can read the "Real Trend" report, but don't consider it the real news story for all the areas, since it doesn't show the numbers month by month, and fails to break down sales by area. Comparing North Walton with South Walton real estate, and using those numbers as a guide for either area, is like comparing apples and blueberries.
I encourage people to search out the entire truth and not rely on some total market report, like the "Real Trend" report. I post a brief monthly summary in the Blog section of SoWal.com and if you would like to see the actual numbers for the last ten years on a spread sheet, simply ask to subscribe by email to my monthly reports. It may help you locate hot and cold spots in the market, and find sales data which better relates to your own property, or property of interest to you.
Edited
Beach Fanatic
First, let me say that the latest "Real Trend" report was for June 2008, not July.
My typographical mistake.
Don't mistake all of Walton County with sales in South Walton from Mack Bayou Rd to Inlet Beach.
(I don't make that mistake, but I only have access to the real trend report. thanks for posting additional data, it is very revealing. see below).
For that particular area, it was somewhere in the middle comparing each month to 2007, with Jan, Feb and April being better than June. However, June 2008 sales volume ($) was the highest month, year to date, with total sales of $42,414,148, which is 17% higher than our second best month this year (April).
For that area, the following are the numbers for June 2008:
SFD (single family detached homes)
34 % increase in qty of sales over 2007 (51 sales in June 2007)
(If I do the math correctly, that means there were about 68 sales in that area in 2008, correct? Making the average sales price in 2008 about $625k +/-, correct? doing the same math for 2007, the average price was about $940k, correct? That equates to an average year over year price decrease of about 34%, correct? now that is an interesting piece of information. we do need to dig a little deeper. The price decrease in Sowal is HUGE compared to all of walco.)
13 % decrease in total dollar volume compared to 2007
If you review the last 24 months, you will see that June 2007 was the highest $ volume month we had, with sales volume of $48,169,400. Our second highest month in that same 24 month period was June 2008, with $42,414,148.
[B](certainly not surprising, haven't the spring months historically been the best in terms of real estate sales?)[/B]
As for lots in that same area, yes, sales ($) were very low, but they have been all year long. However, I can tell you that it was our second best month this year, falling only behind January sales.
If you want to know what areas are doing well, you need to break down the numbers, and if you want to know the real story of real estate, take the "Real Trend" report with a grain of salt.
(No doubt. But, I will take yours with a grain of salt too. Your analysis stops short of telling the whole story as noted in the average price comparison noted above.)
You can read the "Real Trend" report, but don't consider it the real news story for all the areas, since it doesn't show the numbers month by month, and fails to break down sales by area. Comparing North Walton with South Walton real estate, and using those numbers as a guide for either area, is like comparing apples and blueberries.
(you are absolutely right. as noted above, the average sales price for homes in the specific area you quoted is down much, much more than for all of Walco--see notes above.)
I encourage people to search out the entire truth
(I also encourage people to get the rest of the story when reviewing any data. In the real trend data I post, I am simply relaying the only info I have access to. Please continue to feed us data on sowal and include year over year comparisons in your post. This info can be very revealing as noted above. Simply stating that June sales were better than January sales in the same calendar year doesn't tell us much.)
and not rely on some total market report, like the "Real Trend" report. I post a brief monthly summary in the Blog section of SoWal.com and if you would like to see the actual numbers for the last ten years on a spread sheet, simply ask to subscribe by email to my monthly reports. It may help you locate hot and cold spots in the market, and find sales data which better relates to your own property, or property of interest to you.
See comments above.
Edited
Beach Fanatic
Not sure if Murray has his numbers quite right. He is a realtor and should be trying to spin a nice story. Unfortunately he doesn't do much analysis--like comparing year over year trends. He is only selectively pulling numbers versus the complete walco raw data noted above from the real trend report.
Murray's numbers don't jive with the numbers in the real trend report so someone has bad data. Also, Murray fails to compare numbers to the same month in 2007.
According to the real trend report (can't vouch for its accuracy), there were 143 homes sold in all of WalCo in June 2007 and only 115 in June 2008.
First of all, I shouldn't be trying to "spin" any story. My goal is to accurately report information to people who care.
I don't have bad numbers, unless Realtors are reporting incorrectly. I state my source for the numbers comes from Realtor assisted sales, and I break them down by area. Foreclosures sold on the Court House steps, and For Sale by Owners, which don't involve a Realtor on the buyer's side, will also not be included in my numbers. I also don't run numbers for areas in north Walton outside of the Freeport area. Real Trend report includes all transactions in Walton County, including transactions which are not "arms-length" transactions.
As for not comparing this year over last year, that is just not true. I just keep my summary's simple, and ask that anyone wanting more information in specific to ask. I include month by month reports dating back to 1998, for anyone subscribing (FREE) to my monthly emails. Perhaps you should sign up to see, before speaking incorrectly. I would post my spreadsheets on SoWal.com for everyone to see for themselves, but the file size is much too large to upload, seeing that it includes 13 different worksheets of analysis with multiple pages on each worksheet.
Murrays numbers indicate that the total dollar volume for the 98 sales in sowal was about $72 million. Real trend shows dollar volume for the 115 sales in all of walco at just $68 million.As noted in my summary, those 98 sales were for combined residential, which includes homes, townhomes, and condos. If you want the break down, you should subscribe to my emails with spreadsheets.
Murrays numbers show 98 sold in Sowal and 14 in Freeport for a total of 112 in those two markets alone. Real trend shows 115 sales in ALL of walco.Again, you are misreading my summary. The 98 sales is combined residential for South Walton.
Who has the correct data???? Maybe someone in the know can figure out which source is correct.
Edited
Beach Fanatic
As noted in my summary, those 98 sales were for combined residential, which includes homes, townhomes, and condos. If you want the break down, you should subscribe to my emails with spreadsheets.
Again, you are misreading my summary. The 98 sales is combined residential for South Walton.
Here is your quote from the blog--
"Starting with the big picture first, home sales continue to be fairly level with 98 selling in South Walton, though we are down slightly compared to May of 2008 (110 sold)."
You did not clarify that the 98 included condos, SFH and townhomes. You said homes which in my simple mind means houses, not condos. I misinterpreted your words.
I appreciate the fact that you post specific data on sowal, but the blog entries make it sound as if the market is on the upswing which is in actuality it is not. That is why I used the term spin.
Edited

SoWal InsiderAuthor
Here is your quote from the blog--
"Starting with the big picture first, home sales continue to be fairly level with 98 selling in South Walton, though we are down slightly compared to May of 2008 (110 sold)."
You did not clarify that the 98 included condos, SFH and townhomes. You said homes which in my simple mind means houses, not condos. I misinterpreted your words.
I appreciate the fact that you post specific data on sowal, but the blog entries make it sound as if the market is on the upswing which is in actuality it is not. That is why I used the term spin.
Sales volume is on an upswing while prices are still dropping. IMHO prices will continue to drop over the next three years or so as foreclosure activity is still picking up.
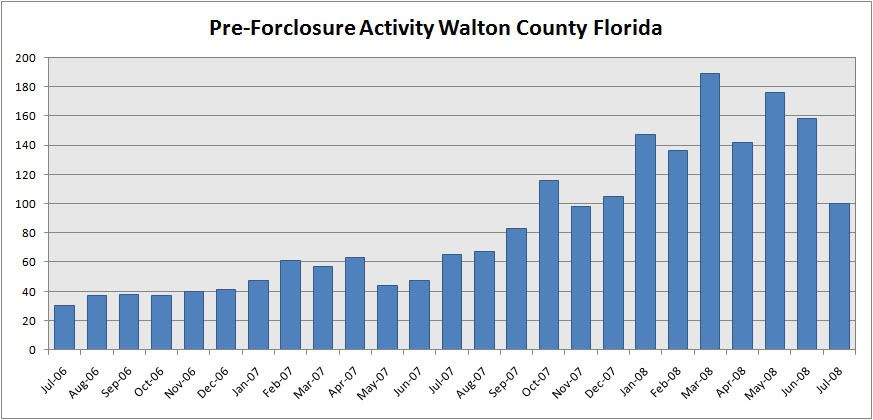
I think this is just getting started. Realtors though will do well, they'll need to move property in larger volumes but I doubt that will be an issue. I'd be willing to call a bottom on sales volume. Prices however are a long way off from bottoming out.
Beach Fanatic
See comments above.
34 % increase in qty of sales over 2007 (51 sales in June 2007)My typo. Should read (and I edited my post):34 % increase in qty of sales over 2007 (51 sales in June 2008)
(single family detached homes between Mack Bayou and Inlet Beach)
month year qty avg sale
Jan 2008 23 $876,036
Feb 2008 29 $687,420
Mar 2008 42 $605,784
Apr 2008 32 $1,082,743
May 2008 43 $719,194
Jun 2008 51 $831,649
Edited
Beach Fanatic
Here is your quote from the blog--
"Starting with the big picture first, home sales continue to be fairly level with 98 selling in South Walton, though we are down slightly compared to May of 2008 (110 sold)."
You did not clarify that the 98 included condos, SFH and townhomes. You said homes which in my simple mind means houses, not condos. I misinterpreted your words.
I appreciate the fact that you post specific data on sowal, but the blog entries make it sound as if the market is on the upswing which is in actuality it is not. That is why I used the term spin.
You are correct that I began with "home sales." I followed that with "lot sales." People consider their townhome, condo, and single family detached homes as their homes. I have started each of my real estate blogs with the combined residential, and this was no exception, but I apologize if that was misleading.
You say that may blog entry sound as though the market is on the upswing. I encourage you to go back and read my June 2008 blog, and tell me what in specific or general makes you think that. I went so far as to compare and contrast June 2008 to June in the peak of the market, 2005. I noted that inventory is more than twice what I'd like to see for both lots and homes. We are still in a down market, make no mistake, but we have seen a few months of steadiness in many areas. My post above, was to rebut your language that we are seeing our worst month this year. That is just not true for certain areas.
I sincerely invite you to subscribe (FREE) to my monthly email which includes the quantity of sales, ave list price, average sales price, and inventory quantity, breaking it out by area, type of property, with some areas and types combined. I also encourage questions, because as I mention, numbers can be deceiving sometimes.
Edited

Admin
Murray is always smiling, but he doesn't "spin". Thanks for sharing Murray> I hope that others appreciate it as much as I do. I would enjoy hearing about specific deals from time to time that you find interesting. I don't just mean properties currently for sale but also details about interesting transactions pending or closed.
SoWal Insider
Sales volume is on an upswing while prices are still dropping. IMHO prices will continue to drop over the next three years or so as foreclosure activity is still picking up.
I think this is just getting started. Realtors though will do well, they'll need to move property in larger volumes but I doubt that will be an issue. I'd be willing to call a bottom on sales volume. Prices however are a long way off from bottoming out.
While I always find your 30-A Shopper Charts™ very interesting
 , what makes you think that foreclosure activity is picking up and not close to peaking? And why do you believe prices are a long way off from bottoming out?
Is there any way to tell how many more foreclosures might be coming down the pike?

Beach Fanatic
The foreclosures are the pig in the python!!!! Until they clear the market, all the graphs and intuition don't mean squat. While all real estate is local, to a large extent, the ability for Buyers to buy has nothing to do with local conditions and many of the buyers are from non-local areas. If you want to know when the real estate market first starts ( 6-9 months before all these charts reflect changes) watch the "smart" money on wall street. I know what you're reaction is, but believe me these folks have access to info well before it trickles down to the public. You can't realistically follow the merger and aquisition activity, the hedge funds, or endowment fund activity, but you can follow the Homebuilders stocks thru their ETF sticker symbol XHB. Their loss has been much more extreme in this real estate downturn and their appreciation will far exceed the bouce back in the real estate market. Couple that with the two times leverage of the Proshares Ultra Real Estate, and no holding costs like physical real estate, I contend that you can get just as good R.O.I. with none of the hassle ( and get paid dividends in the meantime ).
SoWal InsiderAuthor
While I always find your 30-A Shopper Charts? very interesting
Is there any way to tell how many more foreclosures might be coming down the pike?
The chart is a little deceiving, I probably shouldn't have included the month of July. (The last bar is incomplete by two weeks and in general will probably be a slow month for processing and filing.)
I base my assumption on the hunch that a majority of loans along 30-A were ALT-A loans, most of which have yet to reset. The best way to predict what's coming would be to do a survey of loan type and reset date for the area, which as far as I know is impossible without going through every loan contract manually. (Maybe that data is out there some where and I don't know about it?)
As far as prices, it's a general prediction. We're in a housing slump, and slumps last a long time. Plus there is evidence out there that a large cross section of housing along 30-A has yet to correct at all with a lot of people still holding out. Loan reset dates are looming closer however. Overall, I think a safe assumption would be that generally, prices will continue to decline.
In the short term, it's interesting to note that foreclosures in Walton are averaging around 6 months from first filing to landing on the market. So if you look at the graph above, count back 6 months and note that that month is the month that is landing in the market today. What is coming down the pike is everything in between that and now. My guess is the next six months of off season and foreclosures will have a major impact on price. Next years spring season will be very interesting.
"30-A Shopper Charts?" - I think that'll be my new signature!!


SoWal Insider
In the short term, it's interesting to note that foreclosures in Walton are averaging around 6 months from first filing to landing on the market. So if you look at the graph above, count back 6 months and note that that month is the month that is landing in the market today. What is coming down the pike is everything in between that and now. My guess is the next six months of off season and foreclosures will have a major impact on price. Next years spring season will be very interesting.
"30-A Shopper Charts?" - I think that'll be my new signature!!
Can you post your foreclosure chart?
.
SoWal InsiderAuthor
Can you post your foreclosure chart?
I only have pre-foreclosure data. I've not found a way to get actual foreclosure counts out of county records.
Beach Fanatic
My typo. Should read (and I edited my post):34 % increase in qty of sales over 2007 (51 sales in June 2008)
(single family detached homes between Mack Bayou and Inlet Beach)
month year qty avg sale
Jan 2008 23 $876,036
Feb 2008 29 $687,420
Mar 2008 42 $605,784
Apr 2008 32 $1,082,743
May 2008 43 $719,194
Jun 2008 51 $831,649
Now to take the spin off the numbers.
Using your data, the average sale price in June 2007 was $1.265 million. That's a 35% decrease in average price year over year.
What are total sales dollars and volume year to date June 2007 and June 2008? It would be interesting to see how the average price is doing year to date compared to the huge 35% drop in June.
SoWal Insider
Now to take the spin off the numbers.
Using your data, the average sale price in June 2007 was $1.265 million. That's a 35% decrease in average price year over year.
What are total sales dollars and volume year to date June 2007 and June 2008? It would be interesting to see how the average price is doing year to date compared to the huge 35% drop in June.
Are you taking out the $7+million closing for the home in Rosemary from June 2007, which as Murray alluded to somewhere, skewed the numbers from that month?
Beach Fanatic
Are you taking out the $7+million closing for the home in Rosemary from June 2007, which as Murray alluded to somewhere, skewed the numbers from that month?
The $7 million dollar sale in Rosemary occurred in Sept 2006 according to county records.
There were two fairly decent sized sales in RM in June 2007. Throwing those out of the totals brings the average price down to $1.165 million. However, I guess you need to throw a couple of large dollar sales out of the June 2008 numbers to be consistent. Regardless, the average sales price is still WAY down below 2007. In addition, I'm not sure, but I don't believe that short sales and foreclosures are included in the numbers Murray quotes (????). Those are real sales and are an indicator of the true nature of the market. Excluding those sales from the mix skews all of the numbers to the positive side in 2008 versus 2007. I would like to see the numbers including ALL sales in the market.
That's also why I asked for year to date numbers to get a bigger sample size over a longer period of time. Gives you a little better comparison.
Anyway, are you trying to imply that prices aren't really falling in Sowal? This market is not immune to the problems that are plaguing the rest of the country. In fact it is much worse than the average market. Discretionary income is drying up and luxury purchases are being delayed or forgotten. This includes second homes. Unfortunately, it appears that we are in for a very, very rough ride for a couple of years.
Depending on the outcome of the election. It could get much, much worse for secondary home markets. If the democrats sweep, and tax rates skyrocket, the potential roster of buyers of second homes will shrink dramatically.
Edited
SoWal Insider
Anyway, are you trying to imply that prices aren't really falling in Sowal? This market is not immune to the problems that are plaguing the rest of the country. In fact it is much worse than the average market.
Where on earth did you get that idea? Do you think I am an idiot?
Murray said somewhere on an earlier page that the Rosemary closing for $7 million was in June 2007. That is why I asked the question. It seemed like a valid question.
Here is the link to the original post about the Rosemary house, which also indicated that the house closed in June 2007. Perhaps the original post was wrong. At a later time tonight I can go look it up in the public records. Maybe you have already done so.
http://www.sowal.com/bb/showthread.php?t=18557&highlight=rosemary+teardown
Of course prices are falling. Like everyone else reading this thread, I am trying to figure out how much farther there is to go. That is why I asked 30-A shopper more about his chart, and that is why I asked you the question about the $7 million house skewing the numbers.
I don't have rose-colored glasses on about the economy, the current market, the cost of ownership, or anything. I do however believe that South Walton has and will retain a strong inherent value relative to most other coastal areas. As I have said before, if all the other second home markets/coastal areas collapse in value, all bets are off.
SoWal Insider
I just looked it up.
Lyle Finley did indeed purchase that parcel in June 2007, according to the property appraiser's website, and tore it down a few months later. Cost: $7.88 million.
The house next door, which sounds like you may have mistaken it for, also sold for over $7 million, in September of 2006.
So: How or did that purchase skew the June numbers? If you throw out the top and bottom values like an Olympic figure skating judge, what do you get for June 07 and June 08?

SoWal Expert
ECAR sold statistics include any short sales and foreclosures which involve a Realtor on either side of a transaction. ECAR's sold properties are also supposed to include any sold at auction when the auction company is a member of ECAR, per MLS rules.
The average home sale in South Walton is reported in an above post and shows that price increasing over the last two months, and inventory has dropped during that time. Is the sky falling, Chicken Little? Also, using those figures, June's average price is right in line with the average for the year to date.
The average home sale in South Walton is reported in an above post and shows that price increasing over the last two months, and inventory has dropped during that time. Is the sky falling, Chicken Little? Also, using those figures, June's average price is right in line with the average for the year to date.
Checking your forum account
Please wait while we verify your forum account.