Sorry I did not post this last week. Excluding their continued bulk sales of land, Revenue was down 27.22% over the comparable 2013 period. They continue to be unable to generate positive earnings on an operating company level. Market drove stock down 8% early after the opening the day after earning release, closing down over 6%, and lost another 1% yesterday. JOE is one of the heaviest shorted stocks in the US market.
[h=1]Why St. Joe Shareholders Will Inevitably Be Disappointed[/h]Jul. 29, 2014 5:13 AM
[h=2]Summary[/h]
St. Joe's (NYSE:JOE) is one of the most heavily shorted stocks on the market today, and for good reason: there is little support for its underlying valuation on the basis of the value of the land assets on its books. Let's take a look at the company and run shares through the Valuentum style of investing.
This article was sent to 911 people who get email alerts on JOE.
Get email alerts on JOE »
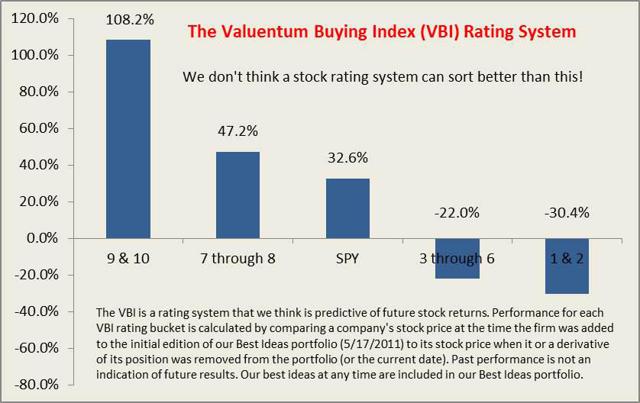
For those that may not be familiar with our boutique research firm, we think a comprehensive analysis of a firm's discounted cash flow valuation, relative valuation versus industry peers, as well as an assessment of technical and momentum indicators is the best way to identify the most attractive stocks at the best time to buy. We think stocks that are cheap (undervalued) and just starting to go up (momentum) are some of the best ones to evaluate for addition to the portfolios. These stocks have both strong valuation and pricing support. This process culminates in what we call our Valuentum Buying Index, which ranks stocks on a scale from 1 to 10, with 10 being the best.
Most stocks that are cheap and just starting to go up are also adored by value, growth, GARP, and momentum investors, all the same and across the board. Though we are purely fundamentally-based investors, we find that the stocks we like (underpriced stocks with strong momentum) are the ones that are soon to be liked by a large variety of money managers. We think this characteristic is partly responsible for the outperformance of our ideas -- as they are soon to experience heavy buying interest. Regardless of a money manager's focus, the Valuentum process covers the bases.
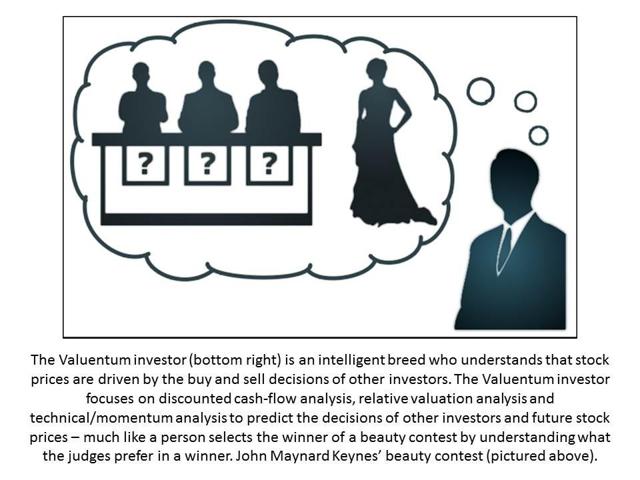
We liken stock selection to a modern-day beauty contest. In order to pick the winner of a beauty contest, one must know the preferences of the judges of a beauty contest. The contestant that is liked by the most judges will win, and in a similar respect, the stock that is liked by the most money managers will win. We may have our own views on which companies we like or which contestant we like, but it doesn't matter much if the money managers or judges disagree. That's why we focus on the DCF -- that's why we focus on relative value -- and that's why we use technical and momentum indicators. We think a comprehensive and systematic analysis applied across a coverage universe is the key to outperformance. We are tuned into what drives stocks higher and lower. Some investors know no other way to invest than the Valuentum process. They call this way of thinking common sense.
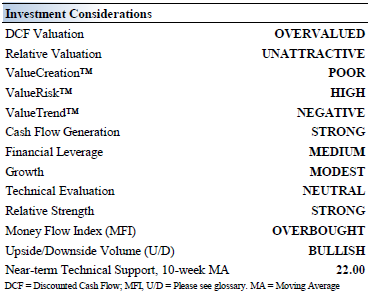
At the methodology's core, if a company is undervalued both on a discounted cash flow basis and on a relative valuation basis, and is showing improvement in technical and momentum indicators, it scores high on our scale. St. Joe posts a Valuentum Buying Index score of 2, reflecting our "overvalued" DCF assessment of the firm, its unattractive relative valuation versus peers, and neutral technical. As many other investors have concluded, the company is significantly overpriced relative to fair value. A score of a 1 or 2 on the Valuentum Buying Index is equivalent to a "we'd consider selling" rating. The market is simply building in land value increases that make little sense with the current reality.
[h=2]St. Joe's Investment Considerations[/h]
[h=2]Investment Highlights[/h]• St. Joe is one of Florida's largest real estate development companies. The firm owns ~185,000 acres located between Tallahassee and Destin. It has significant residential and commercial land-use entitlements in hand or in process. Hedge fund manager David Einhorn is bearish on shares, and the total short interest represents about 45% of the float.
• Traditional valuation metrics such as a PE ratio or PEG ratio and even the discounted cash-flow model don't add much value in evaluating St. Joe's intrinsic worth. Proceeds from land sales in the future will largely drive what St. Joe is ultimately worth.
• Pent up housing demand has been accruing for years, and new home inventory is limited, which makes for an environment conducive to driving housing price improvements (as a result of simple supply/demand dynamics). Though we acknowledge the concept of 'shadow inventory,' overall inventory trends continue to move in the right direction.
• In March 2014, St, Joe sold ~380,000 acres of land for $562 million, which included $200 million in the form of a timber note. Though the land sold was nonstrategic, at $1,400 per acre, it would value the remaining ~185,000 acres on its books at ~$266 million. The market is assigning significantly higher per-acre value to the remaining land on its books.
• Though land prices will be volatile, we're generally optimistic about St. Joe's future (on an operating level). The retiree demographic presents the firm with a unique long-term opportunity given that it owns a substantial amount of land in a desirable part of the US. Whether it garners the land prices the market is factoring in to its share price is a different question altogether--and arguably the most important one.
[h=2]Business Quality[/h]
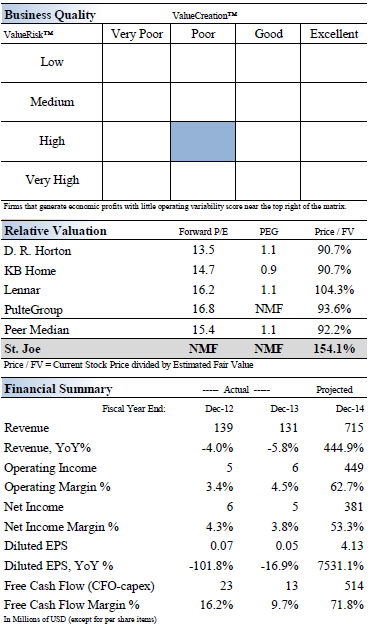
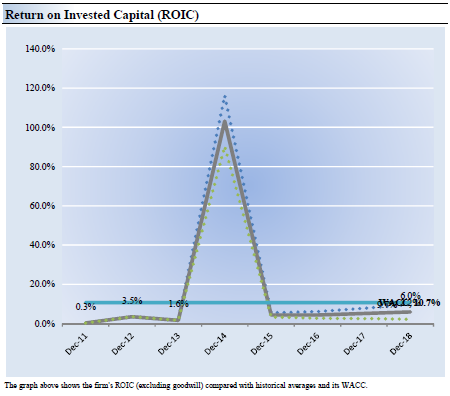
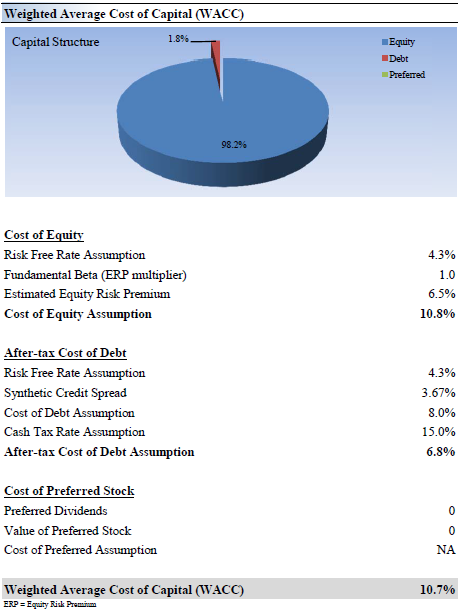
[h=2]Economic Profit Analysis[/h]The best measure of a firm's ability to create value for shareholders is expressed by comparing its return on invested capital with its weighted average cost of capital. The gap or difference between ROIC and WACC is called the firm's economic profit spread. St. Joe's 3-year historical return on invested capital (without goodwill) is 1.8%, which is below the estimate of its cost of capital of 10.7%. Historical returns were bolstered by recent land sales (view spike in graph below).
We assign the firm a ValueCreation™ rating of POOR. In the chart below, we show the probable path of ROIC in the years ahead based on the estimated volatility of key drivers behind the measure. The solid grey line reflects the most likely outcome, in our opinion, and represents the scenario that results in our fair value estimate. Future land sales could boost ROIC, but this is hardly a reason for an attractive Economic Castle rating--land sales will eventually run out.
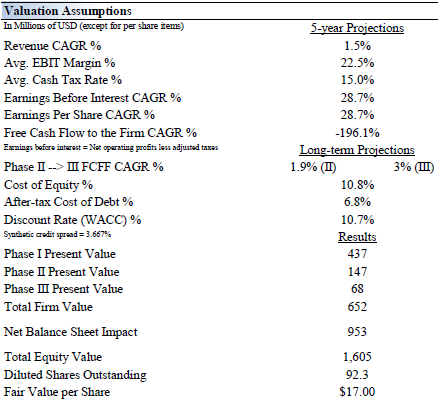
[h=2]Valuation Analysis[/h]Our discounted cash flow model indicates that St. Joe's shares are worth between $11-$23 each. The margin of safety around our fair value estimate is driven by the firm's HIGH ValueRisk™ rating, which is derived from the historical volatility of key valuation drivers. The wide range of fair value estimates rests on the concept that land sales can be quite volatile (and themselves have a wide range of price outcomes)--both to the upside and to the downside.
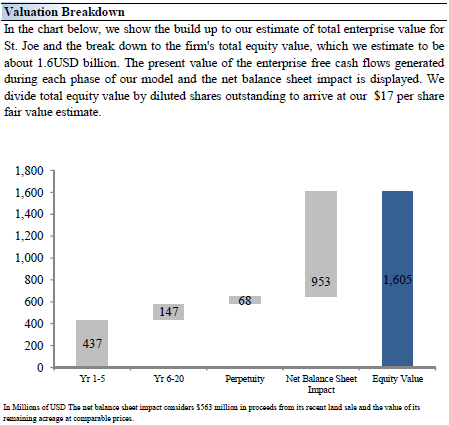
The estimated fair value of $17 per share, however, represents our best estimate of what St. Joe is worth, using precedent and recent land sales (in its own portfolio) in Florida as the basis to calculate intrinsic value. The value of its remaining land is included in the 'net balance sheet' calculation--which assumes that the land will eventually be liquidated at fair prices.
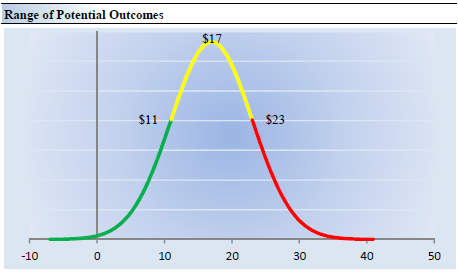
[h=2]Margin of Safety Analysis[/h]Our discounted cash flow process values each firm on the basis of the present value of all future free cash flows. Although we estimate the firm's fair value at about $17 per share, every company has a range of probable fair values that's created by the uncertainty of key valuation drivers (like future revenue or earnings, for example). After all, if the future was known with certainty, we wouldn't see much volatility in the markets as stocks would trade precisely at their known fair values. Our ValueRisk™ rating sets the margin of safety or the fair value range we assign to each stock. In the graph below, we show this probable range of fair values for St. Joe. We think the firm is attractive below $11 per share (the green line), but quite expensive above $23 per share (the red line). The prices that fall along the yellow line, which includes our fair value estimate, represent a reasonable valuation for the firm, in our opinion.
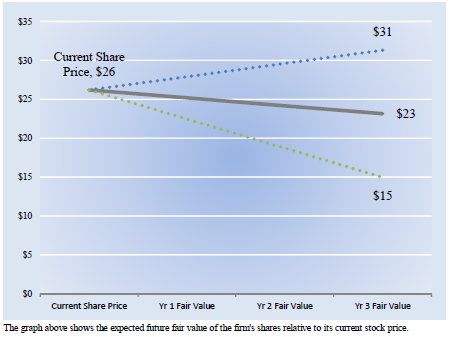
[h=2]Future Path of Fair Value[/h]We estimate St. Joe's fair value at this point in time to be about $17 per share. As time passes, however, companies generate cash flow and pay out cash to shareholders in the form of dividends. The chart below compares the firm's current share price with the path of St. Joe's expected equity value per share over the next three years, assuming our long-term projections prove accurate. The range between the resulting downside fair value and upside fair value in Year 3 represents our best estimate of the value of the firm's shares three years hence. This range of potential outcomes is also subject to change over time, should our views on the firm's future cash flow potential change. The expected fair value of $23 per share in Year 3 represents our existing fair value per share of $17 increased at an annual rate of the firm's cost of equity less its dividend yield. The upside and downside ranges are derived in the same way, but from the upper and lower bounds of our fair value estimate range.
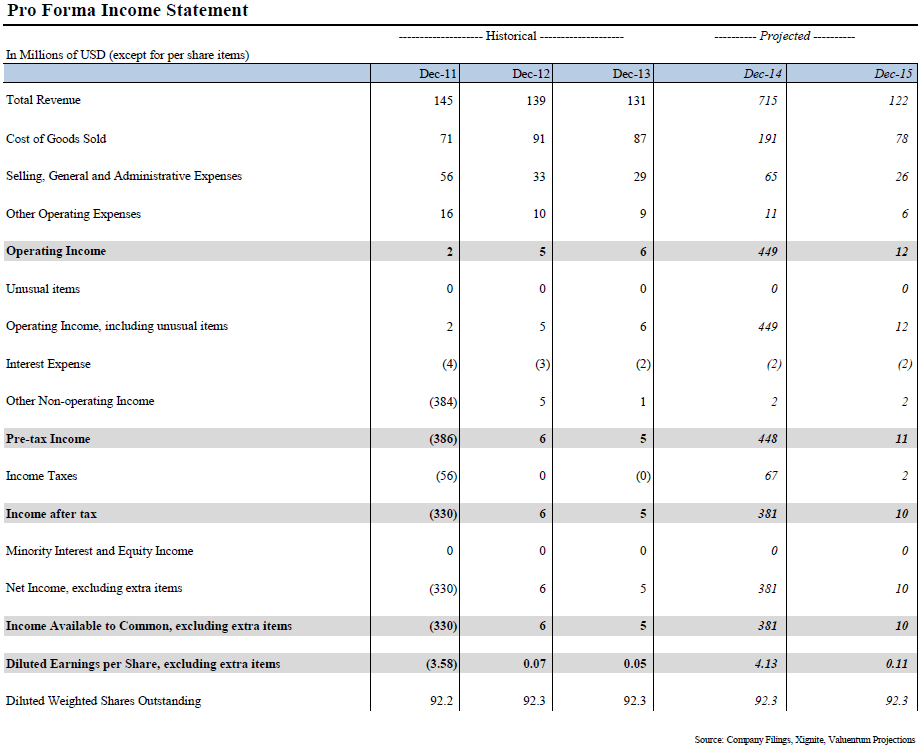
[h=2]Pro Forma Financial Statements[/h](click to enlarge)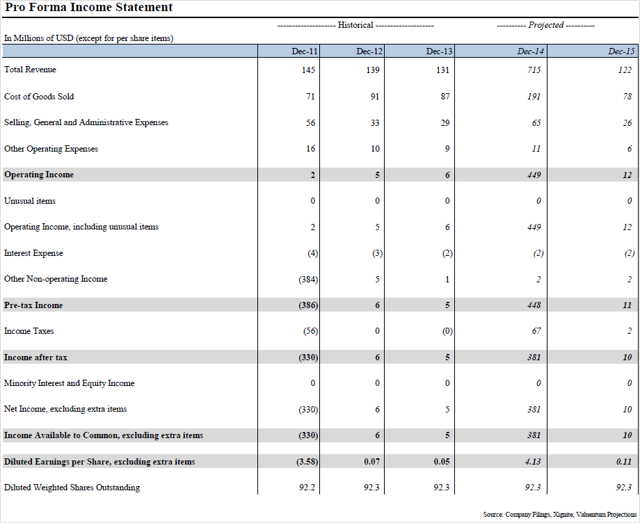
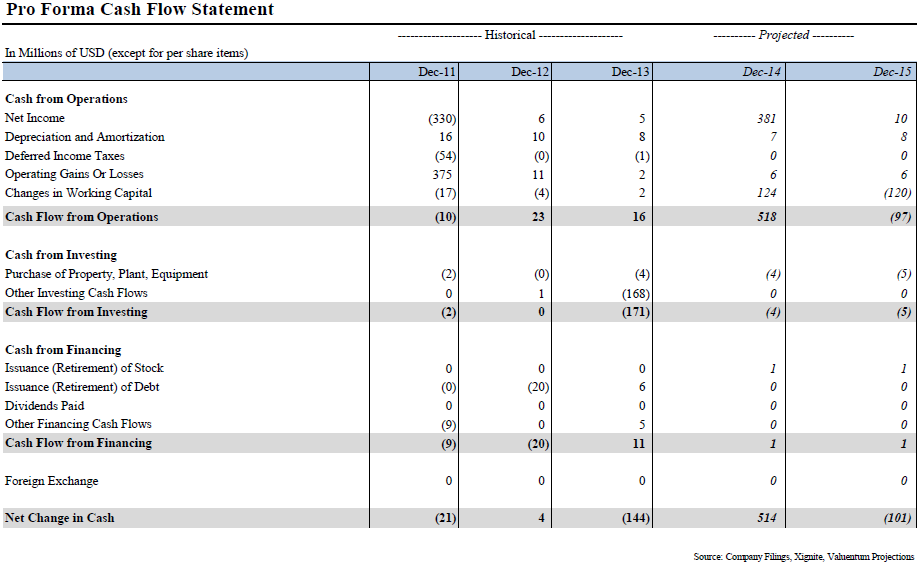
(click to enlarge)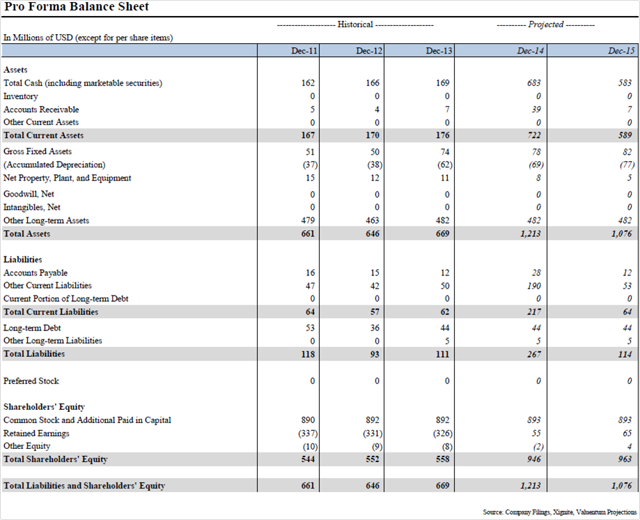
(click to enlarge)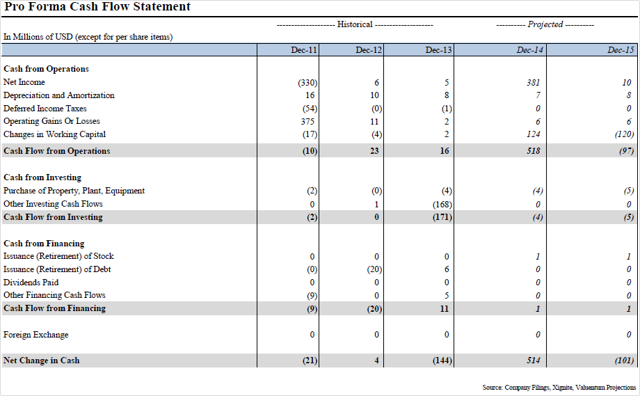
In the spirit of transparency, we show how the performance of the Valuentum Buying Index has stacked up per underlying score as it relates to firms in the Best Ideas portfolio. Past results are not a guarantee of future performance.
[h=1]Why St. Joe Shareholders Will Inevitably Be Disappointed[/h]Jul. 29, 2014 5:13 AM
[h=2]Summary[/h]
- The math simply does not add up in St. Joe's valuation thesis.
- The market is assigning significantly higher per-acre value than recent transaction prices to the remaining land on its books.
- We think the only factor holding the stock up is ongoing de-risking by short investors. Shares are worth $17 each.
St. Joe's (NYSE:JOE) is one of the most heavily shorted stocks on the market today, and for good reason: there is little support for its underlying valuation on the basis of the value of the land assets on its books. Let's take a look at the company and run shares through the Valuentum style of investing.
This article was sent to 911 people who get email alerts on JOE.
Get email alerts on JOE »
For those that may not be familiar with our boutique research firm, we think a comprehensive analysis of a firm's discounted cash flow valuation, relative valuation versus industry peers, as well as an assessment of technical and momentum indicators is the best way to identify the most attractive stocks at the best time to buy. We think stocks that are cheap (undervalued) and just starting to go up (momentum) are some of the best ones to evaluate for addition to the portfolios. These stocks have both strong valuation and pricing support. This process culminates in what we call our Valuentum Buying Index, which ranks stocks on a scale from 1 to 10, with 10 being the best.
Most stocks that are cheap and just starting to go up are also adored by value, growth, GARP, and momentum investors, all the same and across the board. Though we are purely fundamentally-based investors, we find that the stocks we like (underpriced stocks with strong momentum) are the ones that are soon to be liked by a large variety of money managers. We think this characteristic is partly responsible for the outperformance of our ideas -- as they are soon to experience heavy buying interest. Regardless of a money manager's focus, the Valuentum process covers the bases.
We liken stock selection to a modern-day beauty contest. In order to pick the winner of a beauty contest, one must know the preferences of the judges of a beauty contest. The contestant that is liked by the most judges will win, and in a similar respect, the stock that is liked by the most money managers will win. We may have our own views on which companies we like or which contestant we like, but it doesn't matter much if the money managers or judges disagree. That's why we focus on the DCF -- that's why we focus on relative value -- and that's why we use technical and momentum indicators. We think a comprehensive and systematic analysis applied across a coverage universe is the key to outperformance. We are tuned into what drives stocks higher and lower. Some investors know no other way to invest than the Valuentum process. They call this way of thinking common sense.
At the methodology's core, if a company is undervalued both on a discounted cash flow basis and on a relative valuation basis, and is showing improvement in technical and momentum indicators, it scores high on our scale. St. Joe posts a Valuentum Buying Index score of 2, reflecting our "overvalued" DCF assessment of the firm, its unattractive relative valuation versus peers, and neutral technical. As many other investors have concluded, the company is significantly overpriced relative to fair value. A score of a 1 or 2 on the Valuentum Buying Index is equivalent to a "we'd consider selling" rating. The market is simply building in land value increases that make little sense with the current reality.
[h=2]St. Joe's Investment Considerations[/h]
[h=2]Investment Highlights[/h]• St. Joe is one of Florida's largest real estate development companies. The firm owns ~185,000 acres located between Tallahassee and Destin. It has significant residential and commercial land-use entitlements in hand or in process. Hedge fund manager David Einhorn is bearish on shares, and the total short interest represents about 45% of the float.
• Traditional valuation metrics such as a PE ratio or PEG ratio and even the discounted cash-flow model don't add much value in evaluating St. Joe's intrinsic worth. Proceeds from land sales in the future will largely drive what St. Joe is ultimately worth.
• Pent up housing demand has been accruing for years, and new home inventory is limited, which makes for an environment conducive to driving housing price improvements (as a result of simple supply/demand dynamics). Though we acknowledge the concept of 'shadow inventory,' overall inventory trends continue to move in the right direction.
• In March 2014, St, Joe sold ~380,000 acres of land for $562 million, which included $200 million in the form of a timber note. Though the land sold was nonstrategic, at $1,400 per acre, it would value the remaining ~185,000 acres on its books at ~$266 million. The market is assigning significantly higher per-acre value to the remaining land on its books.
• Though land prices will be volatile, we're generally optimistic about St. Joe's future (on an operating level). The retiree demographic presents the firm with a unique long-term opportunity given that it owns a substantial amount of land in a desirable part of the US. Whether it garners the land prices the market is factoring in to its share price is a different question altogether--and arguably the most important one.
[h=2]Business Quality[/h]
[h=2]Economic Profit Analysis[/h]The best measure of a firm's ability to create value for shareholders is expressed by comparing its return on invested capital with its weighted average cost of capital. The gap or difference between ROIC and WACC is called the firm's economic profit spread. St. Joe's 3-year historical return on invested capital (without goodwill) is 1.8%, which is below the estimate of its cost of capital of 10.7%. Historical returns were bolstered by recent land sales (view spike in graph below).
We assign the firm a ValueCreation™ rating of POOR. In the chart below, we show the probable path of ROIC in the years ahead based on the estimated volatility of key drivers behind the measure. The solid grey line reflects the most likely outcome, in our opinion, and represents the scenario that results in our fair value estimate. Future land sales could boost ROIC, but this is hardly a reason for an attractive Economic Castle rating--land sales will eventually run out.
[h=2]Valuation Analysis[/h]Our discounted cash flow model indicates that St. Joe's shares are worth between $11-$23 each. The margin of safety around our fair value estimate is driven by the firm's HIGH ValueRisk™ rating, which is derived from the historical volatility of key valuation drivers. The wide range of fair value estimates rests on the concept that land sales can be quite volatile (and themselves have a wide range of price outcomes)--both to the upside and to the downside.
The estimated fair value of $17 per share, however, represents our best estimate of what St. Joe is worth, using precedent and recent land sales (in its own portfolio) in Florida as the basis to calculate intrinsic value. The value of its remaining land is included in the 'net balance sheet' calculation--which assumes that the land will eventually be liquidated at fair prices.
[h=2]Margin of Safety Analysis[/h]Our discounted cash flow process values each firm on the basis of the present value of all future free cash flows. Although we estimate the firm's fair value at about $17 per share, every company has a range of probable fair values that's created by the uncertainty of key valuation drivers (like future revenue or earnings, for example). After all, if the future was known with certainty, we wouldn't see much volatility in the markets as stocks would trade precisely at their known fair values. Our ValueRisk™ rating sets the margin of safety or the fair value range we assign to each stock. In the graph below, we show this probable range of fair values for St. Joe. We think the firm is attractive below $11 per share (the green line), but quite expensive above $23 per share (the red line). The prices that fall along the yellow line, which includes our fair value estimate, represent a reasonable valuation for the firm, in our opinion.
[h=2]Future Path of Fair Value[/h]We estimate St. Joe's fair value at this point in time to be about $17 per share. As time passes, however, companies generate cash flow and pay out cash to shareholders in the form of dividends. The chart below compares the firm's current share price with the path of St. Joe's expected equity value per share over the next three years, assuming our long-term projections prove accurate. The range between the resulting downside fair value and upside fair value in Year 3 represents our best estimate of the value of the firm's shares three years hence. This range of potential outcomes is also subject to change over time, should our views on the firm's future cash flow potential change. The expected fair value of $23 per share in Year 3 represents our existing fair value per share of $17 increased at an annual rate of the firm's cost of equity less its dividend yield. The upside and downside ranges are derived in the same way, but from the upper and lower bounds of our fair value estimate range.
[h=2]Pro Forma Financial Statements[/h](click to enlarge)
(click to enlarge)

(click to enlarge)
In the spirit of transparency, we show how the performance of the Valuentum Buying Index has stacked up per underlying score as it relates to firms in the Best Ideas portfolio. Past results are not a guarantee of future performance.