Here is your quote from the blog--
"Starting with the big picture first, home sales continue to be fairly level with 98 selling in South Walton, though we are down slightly compared to May of 2008 (110 sold)."
You did not clarify that the 98 included condos, SFH and townhomes. You said homes which in my simple mind means houses, not condos. I misinterpreted your words.
I appreciate the fact that you post specific data on sowal, but the blog entries make it sound as if the market is on the upswing which is in actuality it is not. That is why I used the term spin.
You are correct that I began with "home sales." I followed that with "lot sales." People consider their townhome, condo, and single family detached homes as their homes. I have started each of my real estate blogs with the combined residential, and this was no exception, but I apologize if that was misleading.
You say that may blog entry sound as though the market is on the upswing. I encourage you to go back and read my June 2008 blog, and tell me what in specific or general makes you think that. I went so far as to compare and contrast June 2008 to June in the peak of the market, 2005. I noted that inventory is more than twice what I'd like to see for both lots and homes. We are still in a down market, make no mistake, but we have seen a few months of steadiness in many areas. My post above, was to rebut your language that we are seeing our worst month this year. That is just not true for certain areas.
I sincerely invite you to subscribe (FREE) to my monthly email which includes the quantity of sales, ave list price, average sales price, and inventory quantity, breaking it out by area, type of property, with some areas and types combined. I also encourage questions, because as I mention, numbers can be deceiving sometimes.

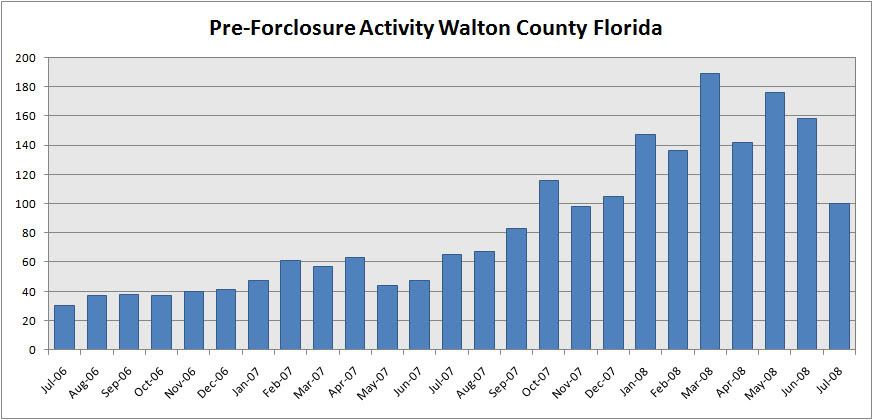
 , what makes you think that foreclosure activity is picking up and not close to peaking? And why do you believe prices are a long way off from bottoming out?